
Research
Red Supergiants in M31: Investigating Binary Candidates in Cluster and Field Environments
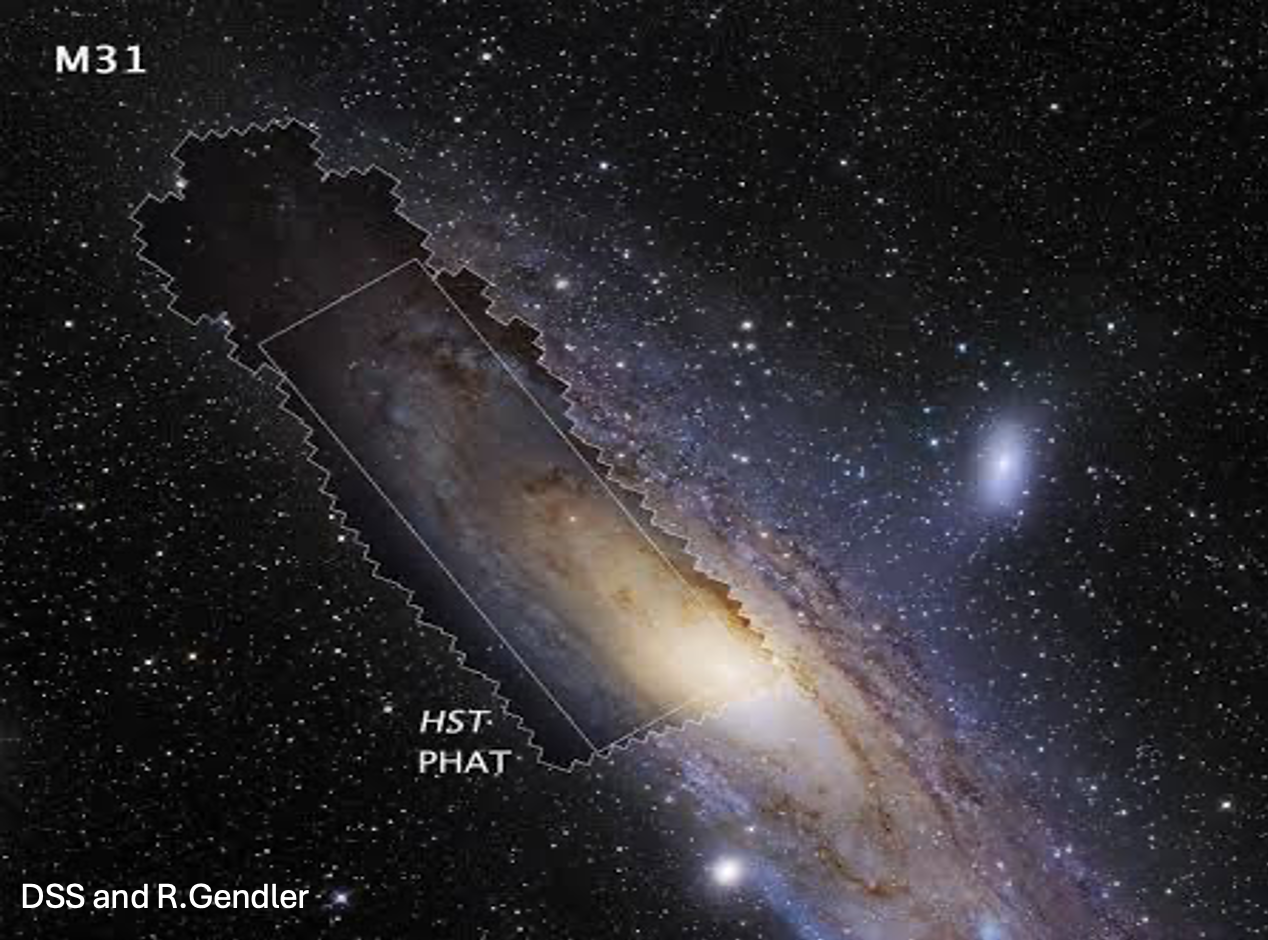
As part of the CIERA REU Program at Northwestern University, I studied red supergiants (RSGs) in the Andromeda Galaxy using data from the Panchromatic Hubble Andromeda Treasury (PHAT) survey and the Andromeda Project cluster catalog through Zooniverse. Under the mentorship of Dr. L. Clifton Johnson, I cross-matched thousands of stars with stellar clusters and developing an age-dependent color and magnitude selection to identify red supergiant candidates. I investigated how cluster properties such as age and mass influence RSG populations and identified candidate binary systems through ultraviolet excess. This project combines large astronomical datasets with statistical analysis to better understand the evolution of massive stars and their role in galaxy evolution.
Research Materials: View Poster | View Research Notes
Introduction
Massive stars play an important role in galaxy evolution through radiation, stellar winds, and supernovae. Evolved helium-burning (HeB) stars, particularly red supergiants, provide important constraints on massive-star evolution, mass loss, and Type II supernova progenitors. Binary interactions can further alter the evolution and observable properties of these stars. Using PHAT photometry and the Andromeda Project cluster catalog, I identified HeB stars and RSGs associated with M31 star clusters. I focused on the RSG population, comparing cluster and field RSGs, examining their relationship with cluster properties, and searching for evidence of binary companions through UV excess emission.
Cluster HeB Star Selection
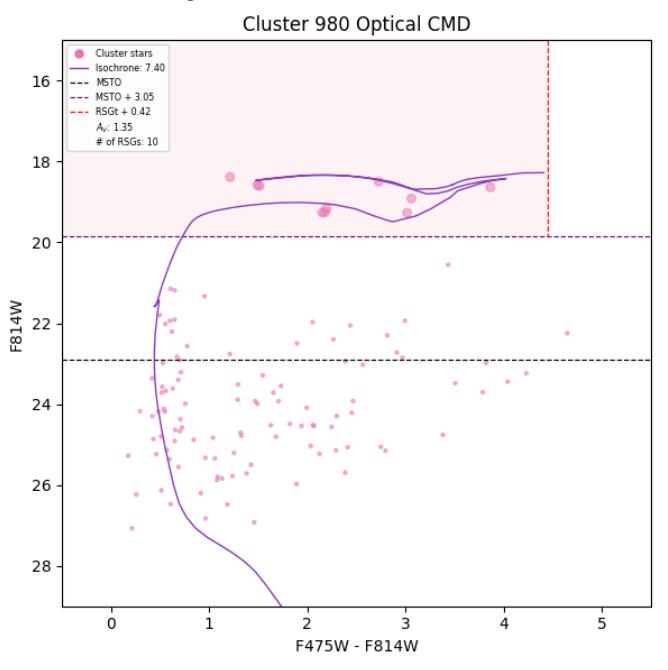
Identifying evolved HeB stars that are members of star clusters provides constraints on the ages and properties of these post-main-sequence populations. Cluster membership was assigned to PHAT stars located within the apertures of clusters in the Andromeda Project catalog. PHAT photometry was filtered using signal-to-noise requirements in the optical bands while avoiding overly restrictive sharpness and crowding cuts that can reduce completeness in crowded cluster environments. HeB candidates were selected based on their position in the optical color-magnitude diagram (F475W−F814W vs. F814W) relative to best-fit Padova isochrones. Candidates were required to be brighter than the main-sequence turn-off (MSTO) and separated from the RGB-tip region using age-dependent boundaries designed to balance completeness and contamination. The analysis focused on clusters with ages appropriate for massive-star RSGs, reducing contamination from older RGB populations.
Results
Cluster RSG Sample
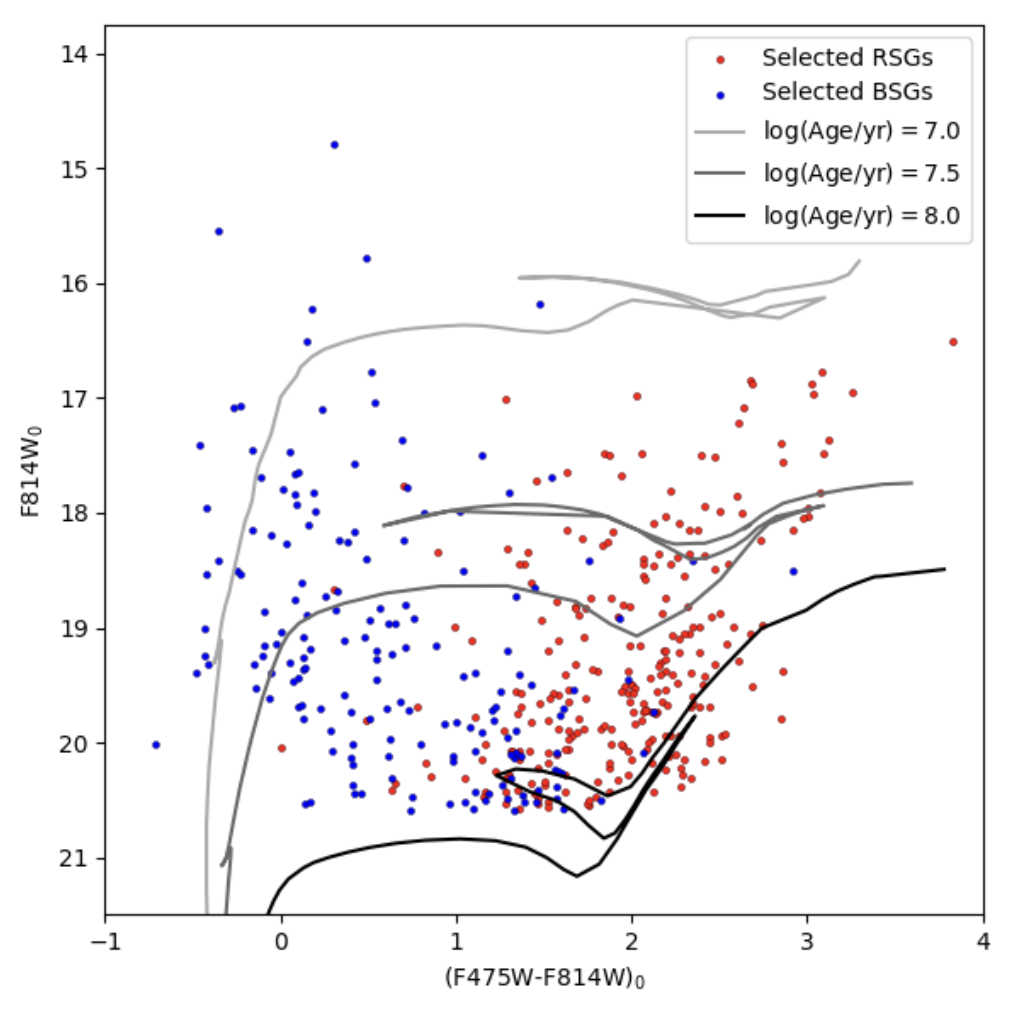
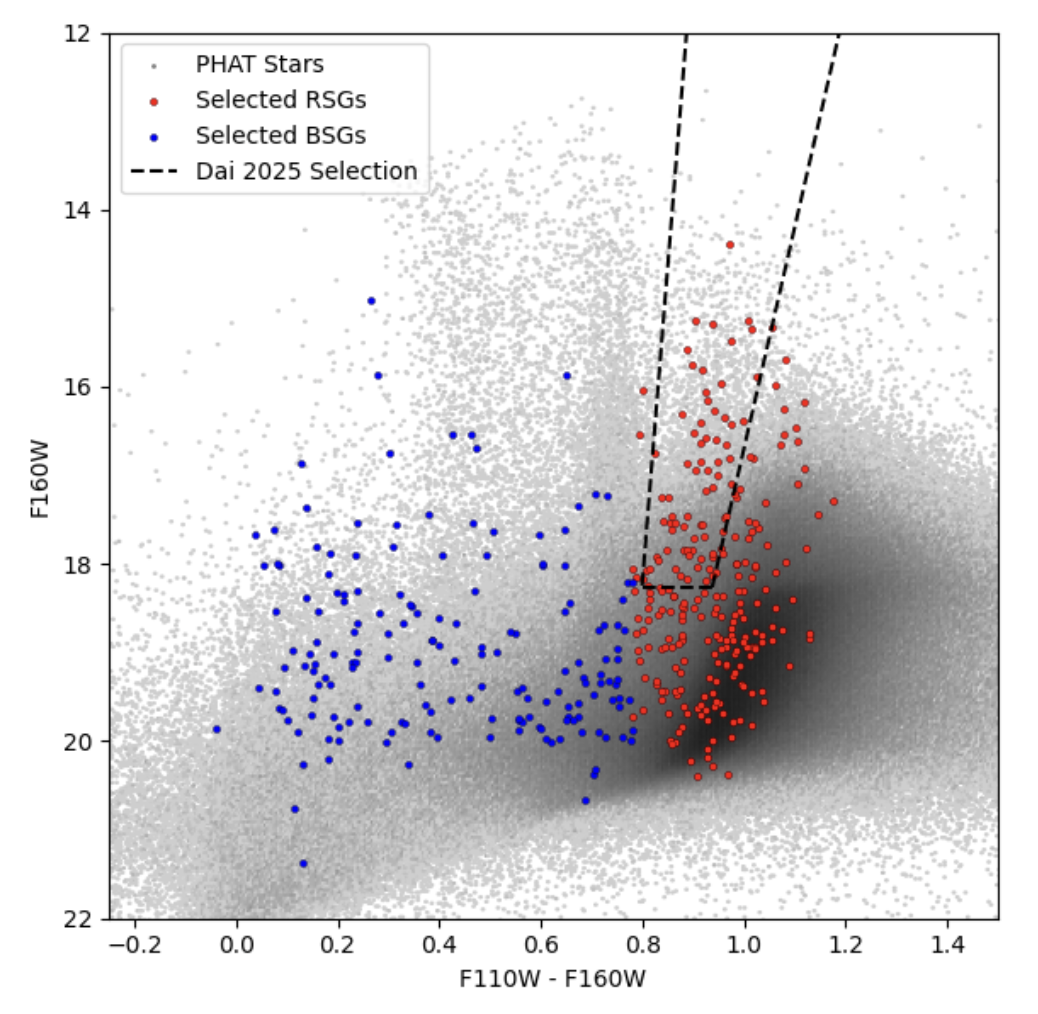
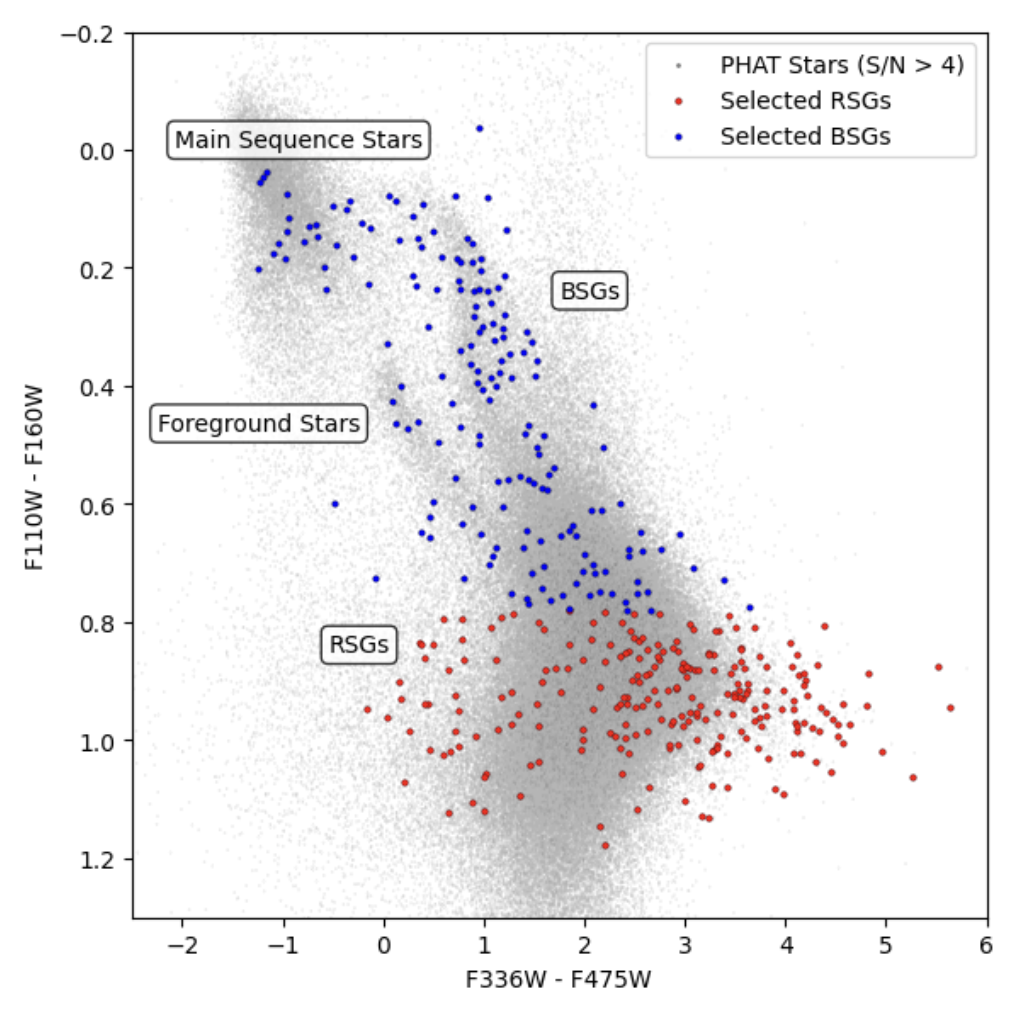
I identified 424 HeB stars across 237 clusters, including 252 RSGs and 170 BSGs. RSGs and BSGs were separated using their F110W−F160W color, with RSGs defined as having F110W−F160W ≥ 0.78. Some contamination from yellow supergiants is possible in both populations. RSG-hosting clusters span log(age/yr) = 6.60–8.00, with approximately 58% of the identified RSGs in the oldest age bin (7.75–8.00). I also calculate the RSG production efficiency of the cluster population as a function of cluster mass to investigate how efficiently clusters produce observable RSGs.
PHAT-wide RSG Sample
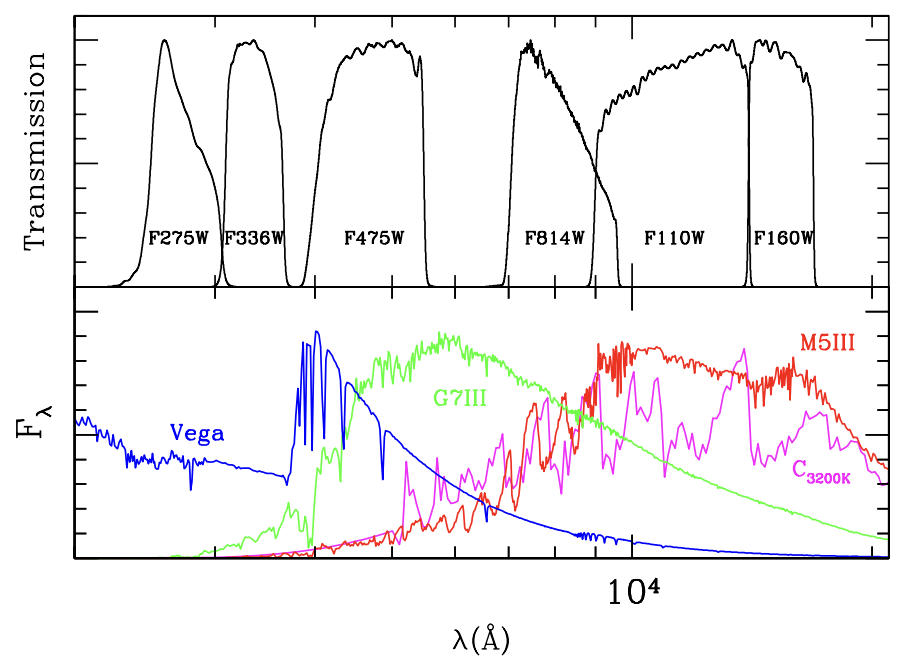
To compare the cluster population with RSGs across M31, I developed a PHAT-wide RSG selection using near-infrared color-magnitude criteria, along with an optical–NIR cut to reduce contamination from asymptotic giant branch (AGB) stars. The selection was based in part on the RSG criteria of Dai et al. (2025), while using photometric quality cuts designed to preserve completeness. This selection identifies 5,188 RSGs across PHAT, including 99 associated with clusters. For comparison, the RSG catalog of Dai et al. (2025) contains 2,612 RSGs, including 81 cluster-associated RSGs. Differences between these samples primarily reflect differences in photometric quality cuts and RSG selection criteria. The PHAT-wide sample provides a larger RSG population for comparing cluster and field environments, particularly at older ages.
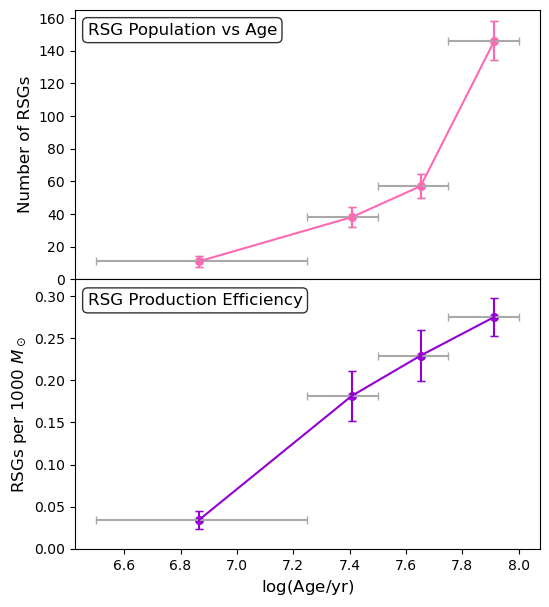
RSG population properties as a function of cluster age for the CMD-selected cluster RSG sample. The top panel shows the number of RSGs and the bottom panel shows the RSG production efficiency per unit cluster mass. Points show the mean cluster age within each age bin with Poisson uncertainties, and grey error bars show bin width.
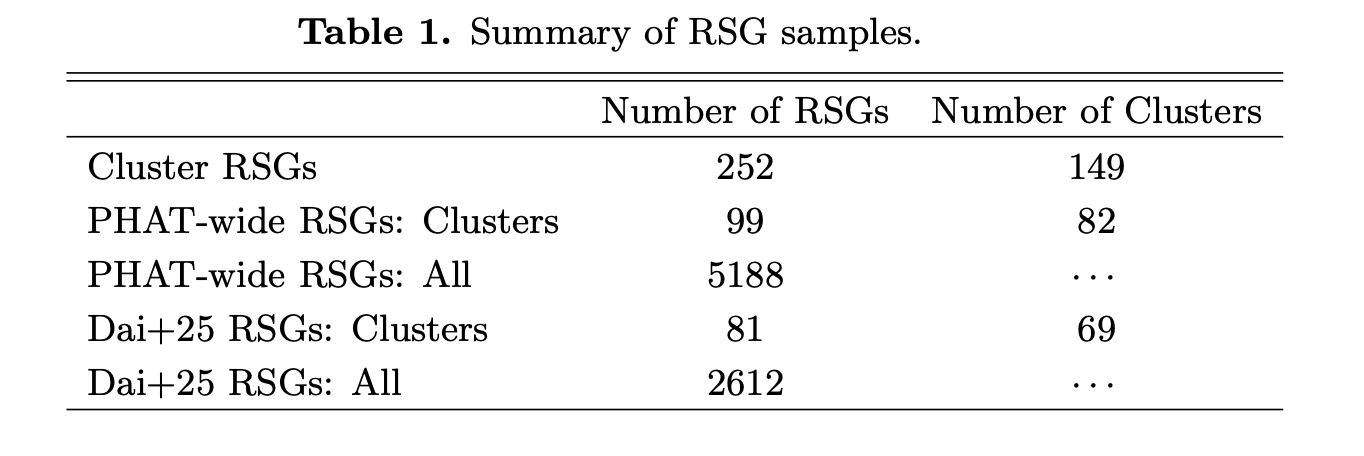
Number of red supergiants (RSGs) and associated clusters identified in each RSG sample, showing the differences between the cluster CMD selection, the PHAT-wide selection, and the Dai et al. (2025) catalog.
Binary Candidates
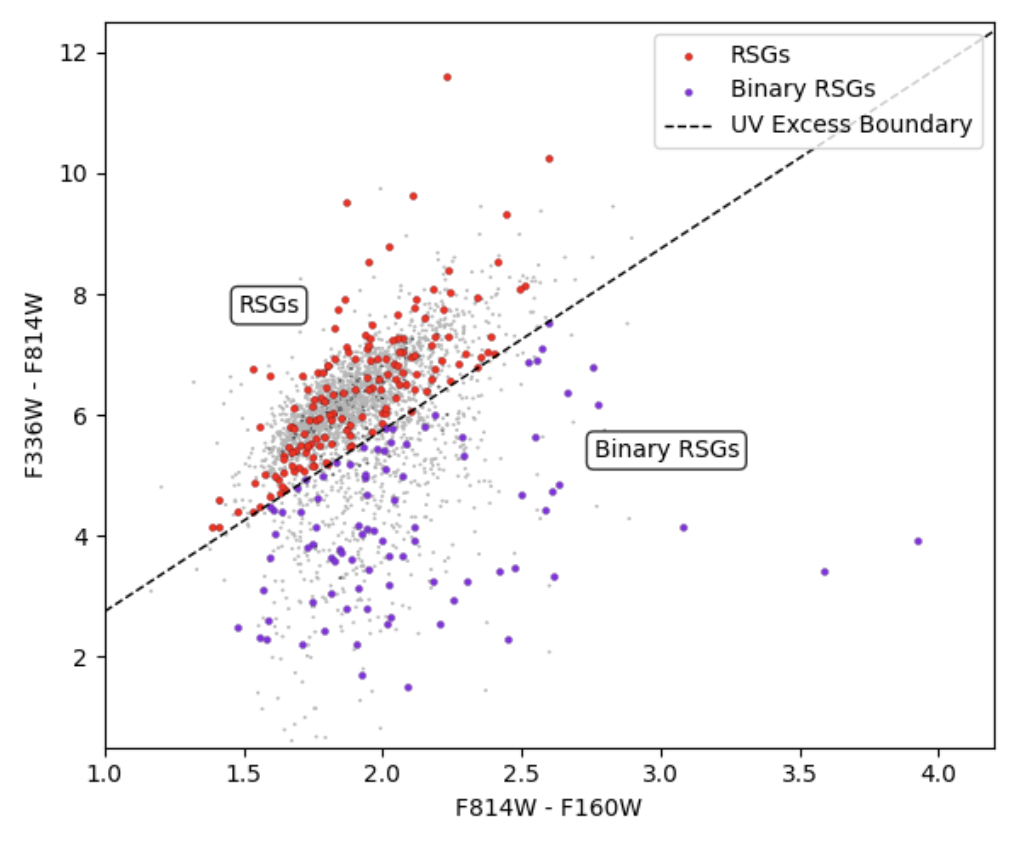
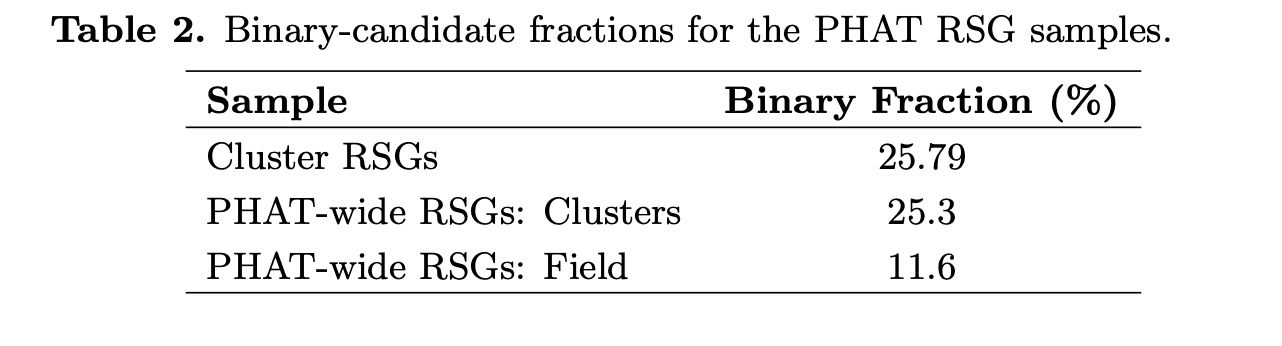
Ultraviolet excess can reveal hot companions to cool RSGs, which produce relatively little UV emission themselves. I identify candidate binaries using an F336W−F814W vs. F814W−F160W color-color criterion inspired by Dai et al. (2025). An F336W signal-to-noise requirement of >4 was used to ensure reliable UV detections, while F275W was excluded because its shallower depth would bias the sample toward brighter UV sources. The observed UV excess is consistent with the presence of a main-sequence companion with a mass of approximately 3–5 M⊙ or greater. The candidate binary fraction is 2.18× higher among cluster-associated RSGs than field RSGs (25.3% vs. 11.6%). This difference provides a potential test of whether stellar environment influences the binary properties and evolution of RSGs.
Ongoing Work
Future work will focus on comparing the observed RSG populations with single-star and binary stellar evolution models to determine whether the observed trends are consistent with theoretical predictions. I will also investigate how the binary-candidate fraction varies with cluster age to explore whether binary interactions become more or less important at different stages of massive-star evolution. Finally, I will examine completeness trends as a function of age to determine how observational biases and selection effects may influence the observed RSG populations, particularly at older ages. Together, these analyses will help distinguish evolutionary trends from observational effects and provide a more complete picture of RSG and binary evolution.
Acknowledgements
I gratefully acknowledge the support of the CIERA Research Experiences for Undergraduates (REU) program at Northwestern Univeristy. This material is based upon work supported by the U.S. National Science Foundation under Award No. AST-2446392. Any opinions, findings, and conclusions or recommendations expressed in this material are those of the author(s) and do not necessarily reflect the views of the NSF.
References
Dai, M., Wang, S., Jiang, B., & Li, Y. 2025, ApJ, 988, 60.
Dalcanton, J. J., Williams, B. F., Lang, D., et al. 2012, ApJS, 200, 18.
Girardi, L., Williams, B. F., Gilbert, K. M., et al. 2010, ApJ, 724, 1030.
Johnson, L. C., Seth, A. C., Dalcanton, J. J., et al. 2015, ApJ, 802, 127, doi: 10.1088/0004-637X/802/2/127
Marigo, P., Girardi, L., Bressan, A., et al. 2008, A&A, 482, 883, doi: 10.1051/0004-6361:20078467
Massey, P., Neugent, K. F., Levesque, E. M., Drout, M. R., & Courteau, S. 2021a, AJ, 161, 79, doi: 10.3847/1538-3881/abd01f
Neugent, K. F. 2021, ApJ, 908, 87, doi: 10.3847/1538-4357/abd47b
Williams, B. F., Durbin, M., Lang, D., et al. 2023, ApJS, 268, 48, doi: 10.3847/1538-4365/acea61
Classifying Galactic Center Sources Through X-ray Time-Domain Analysis
I am currently investigating X-ray point sources near the Galactic Center using data from the Chandra X-ray Observatory under the guidance of Dr. Dustin Swarm. Many of these sources have X-ray spectra consistent with cataclysmic variables (CVs), binary systems where a white dwarf accretes material from a companion star. However, distinguishing between magnetic and non-magnetic CVs using spectral information alone is challenging, leading to uncertainties in estimating white dwarf masses.
To address this challenge, I am performing time-domain analysis of X-ray light curves for a sample of approximately 34 Galactic Center sources. I will analyze the variability and periodic signals within these light curves to identify signatures associated with white dwarf spin and orbital periods. These periodic features will help classify the sources as magnetic or non-magnetic CVs and improve estimates of their physical properties.
This project is ongoing, with current efforts focused on processing Chandra observations, identifying candidate periodic signals, and developing methods to characterize X-ray variability in compact binary systems.